How to Read the Most Popular Crypto Candlestick Patterns
Candlestick patterns are an essential tool in technical analysis, providing traders with visual cues about potential price movements based on historical data. These patterns can indicate whether a price is likely to move upwards or downwards, helping traders make informed decisions. Understanding how to read these patterns is crucial for anyone involved in cryptocurrency trading.
Basics of Candlestick Charts
A candlestick chart displays the open, high, low, and close prices of an asset for a specific period. Each candlestick has a body and wicks (or shadows).
- Body: Represents the range between the opening and closing prices.
- Wicks: Represent the highest and lowest prices during the period. The upper wick shows the high, and the lower wick shows the low.
- Color: Typically, a green (or white) body indicates a price increase (close higher than open), while a red (or black) body indicates a price decrease (close lower than open).
Popular Candlestick Patterns
1. Bullish Patterns
a. Hammer:
- Description: A candle with a small body and a long lower wick, occurring after a downtrend.
- Significance: Indicates potential reversal from a downtrend to an uptrend.

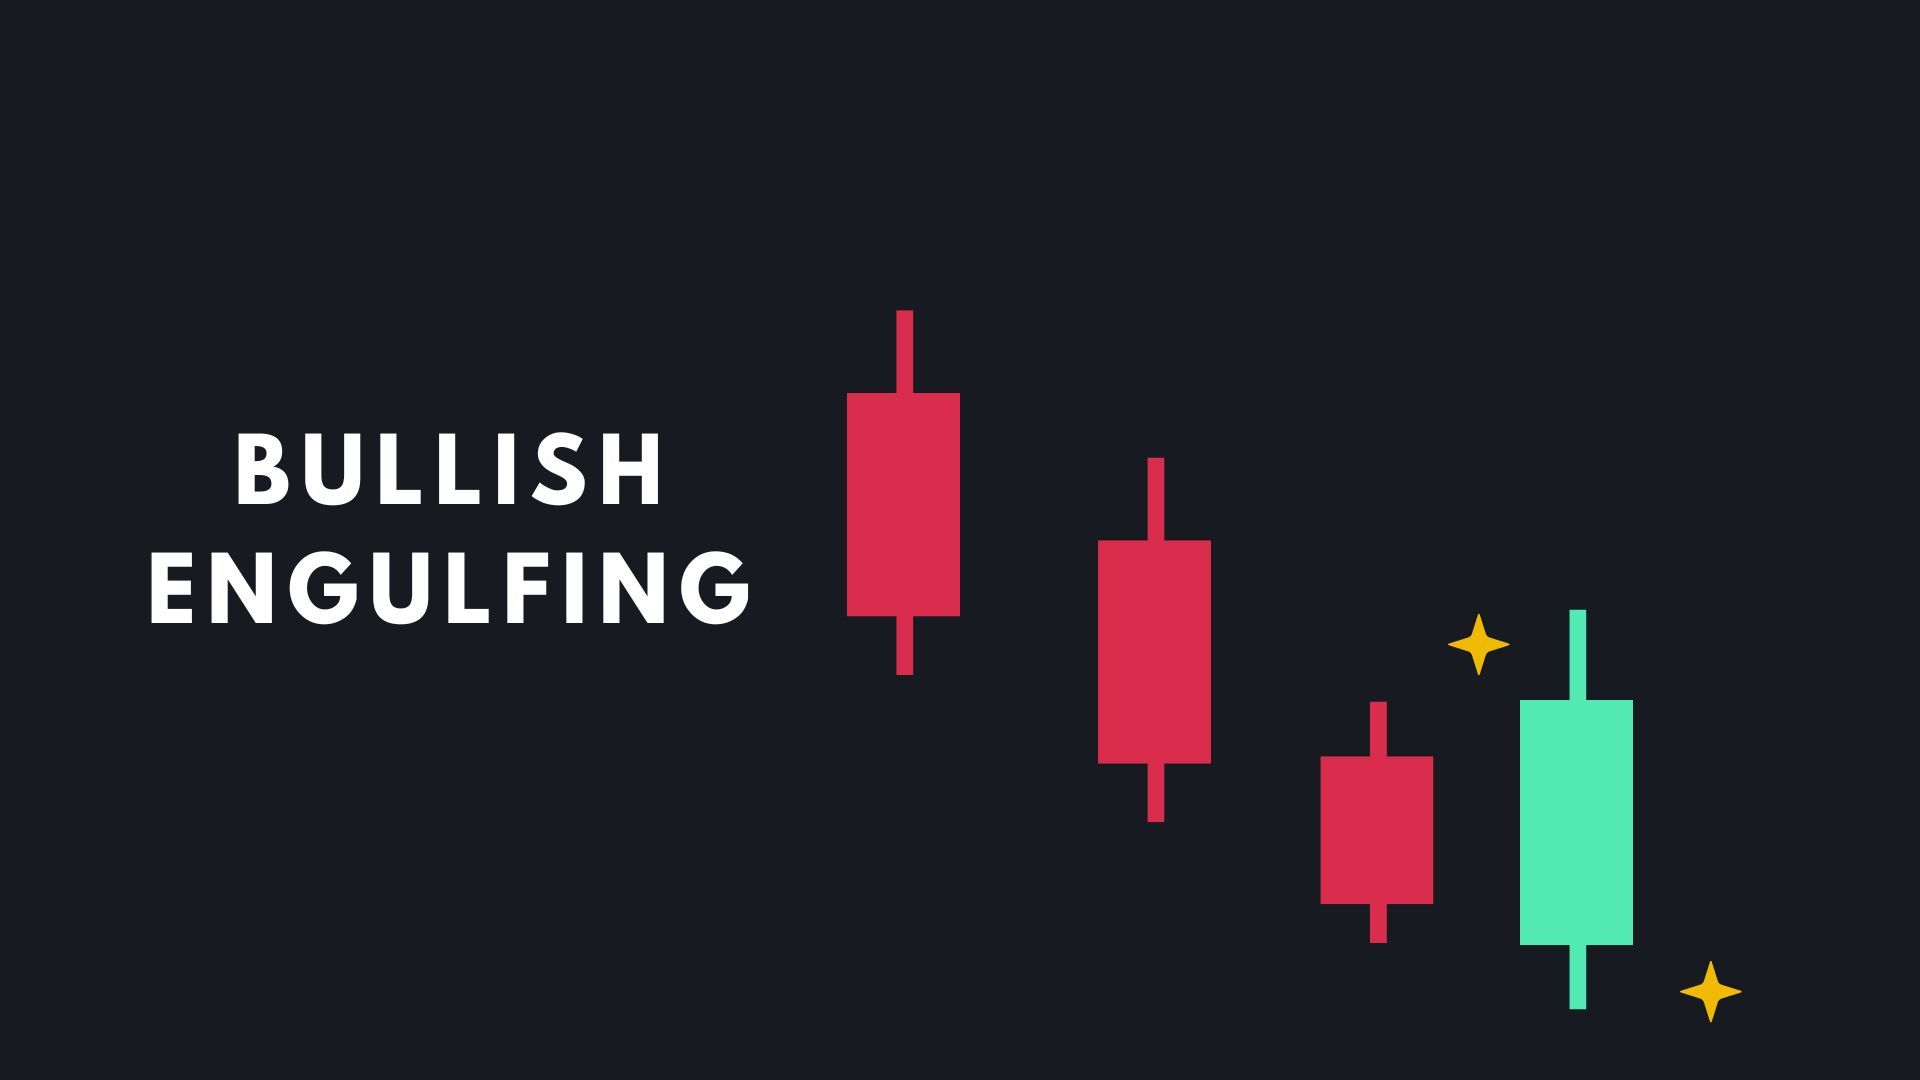
b. Bullish Engulfing:
- Description: A small red candle followed by a larger green candle that completely engulfs the red one.
- Significance: Signals strong buying pressure and a potential reversal to an uptrend.

c. Morning Star:
- Description: A three-candle pattern with a long red candle, a small-bodied candle, and a long green candle.
- Significance: Suggests a potential reversal from a downtrend to an uptrend.

2. Bearish Patterns
a. Shooting Star:
- Description: A candle with a small body and a long upper wick, occurring after an uptrend.
- Significance: Indicates potential reversal from an uptrend to a downtrend.

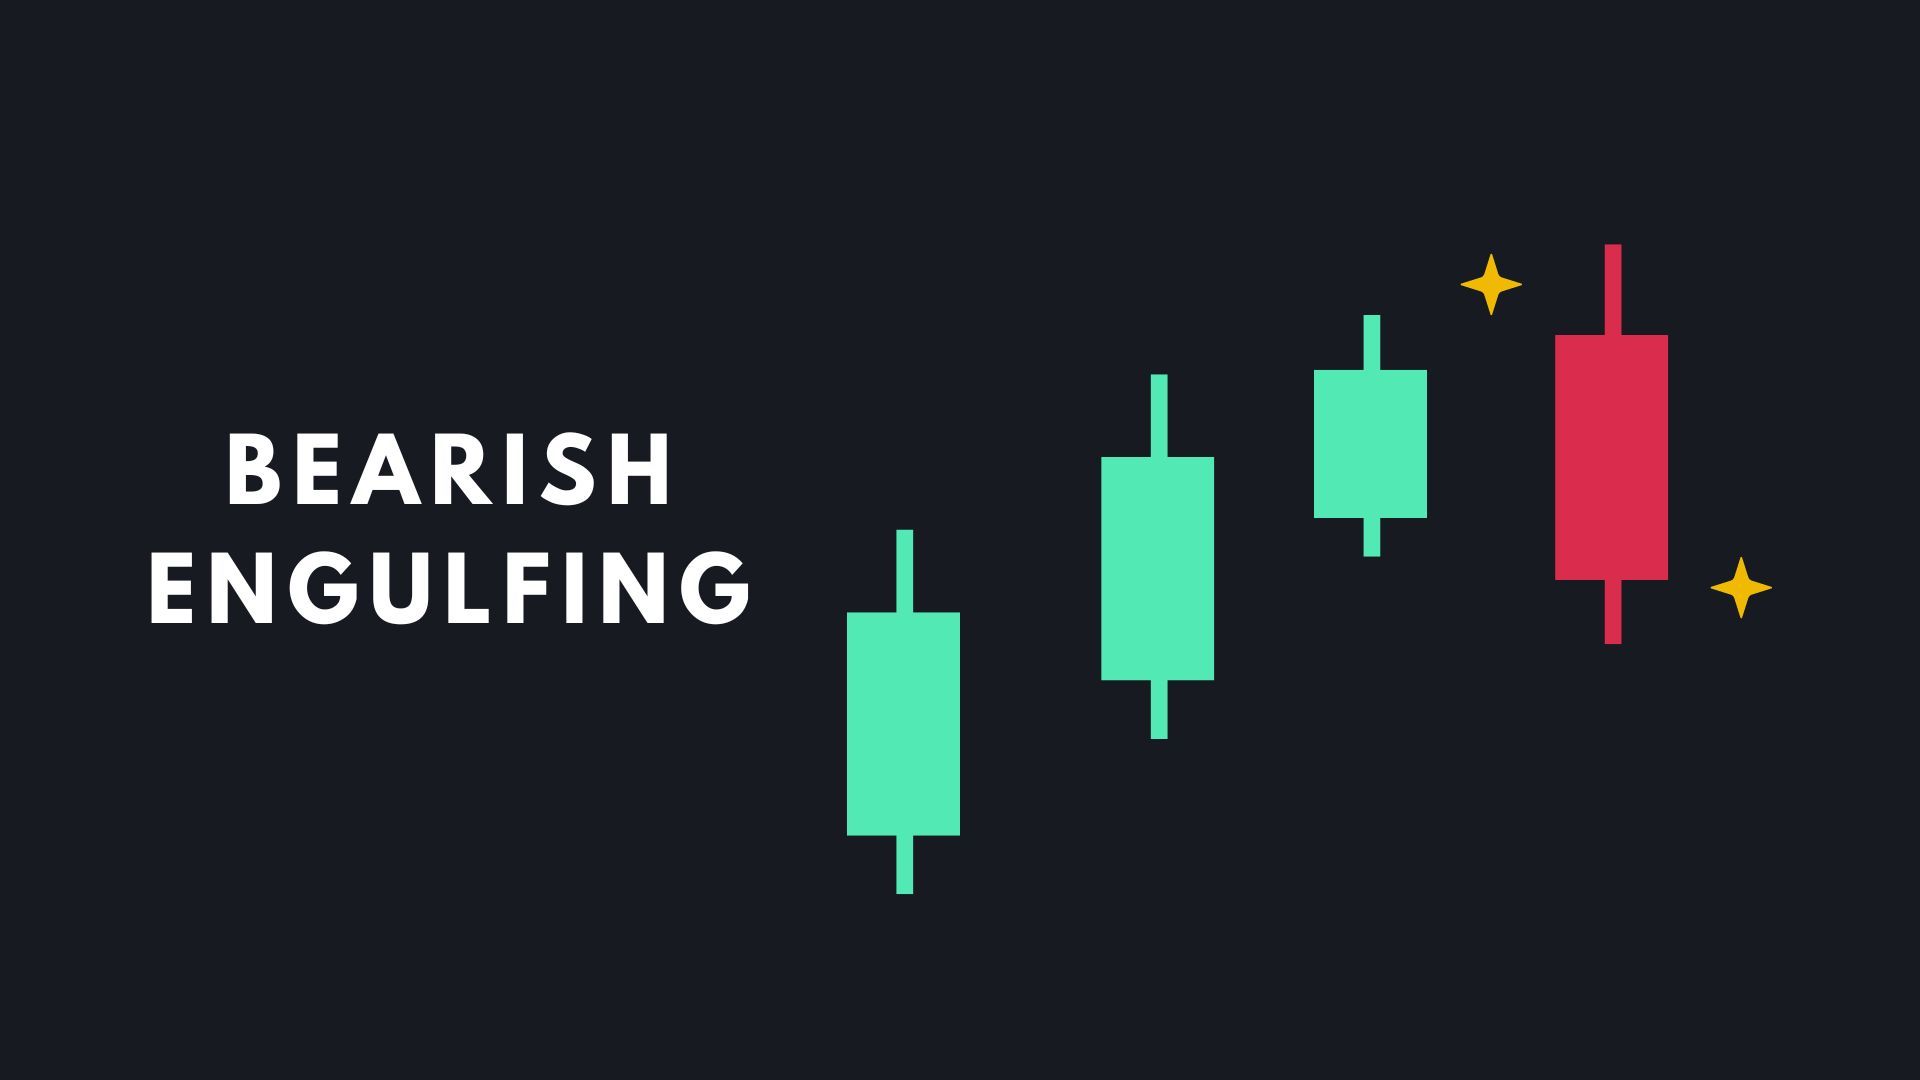
b. Bearish Engulfing:
- Description: A small green candle followed by a larger red candle that completely engulfs the green one.
- Significance: Signals strong selling pressure and a potential reversal to a downtrend.

c. Evening Star:
- Description: A three-candle pattern with a long green candle, a small-bodied candle, and a long red candle.
- Significance: Suggests a potential reversal from an uptrend to a downtrend.

3. Continuation Patterns
a. Doji:
- Description: A candle where the open and close prices are almost identical, creating a very small body.
- Significance: Indicates indecision in the market. Depending on the context, it can signal a potential reversal or continuation.

b. Spinning Top:
- Description: A candle with a small body and long wicks on both sides.
- Significance: Suggests indecision, but if found within a trend, it may indicate a potential continuation.

c. Three White Soldiers:
- Description: Three consecutive long green candles with short wicks.
- Significance: Indicates strong buying pressure and the continuation of an uptrend.

d. Three Black Crows:
- Description: Three consecutive long red candles with short wicks.
- Significance: Indicates strong selling pressure and the continuation of a downtrend.

How to Use Candlestick Patterns
Confirm with Other Indicators
Candlestick patterns are more powerful when used in conjunction with other technical indicators, such as moving averages, RSI, or MACD, to confirm signals.
Consider the Context
The effectiveness of candlestick patterns can vary based on their context within the overall trend. Always consider the broader market trend when interpreting patterns.
Manage Risk
Use stop-loss orders to manage risk and protect against potential losses. Even reliable patterns can fail, so it's essential to have a risk management strategy in place.
Conclusion
Candlestick patterns are a vital tool for cryptocurrency traders, offering insights into potential price movements based on historical data. By learning to recognize and interpret these patterns, traders can enhance their decision-making process and improve their trading strategies. Always combine candlestick analysis with other technical indicators and risk management practices to make well-informed trading decisions.
Disclaimer: The content provided in this article is for informational purposes only and does not constitute financial advice. Engaging in cryptocurrency trading involves significant risk. Please conduct your own research and consult with a financial advisor before making any investment decisions.4o

